The glycemic load of foods (GL) is one of the most useful parameters in nutrition. It is even more important than the glycemic or insulin index.
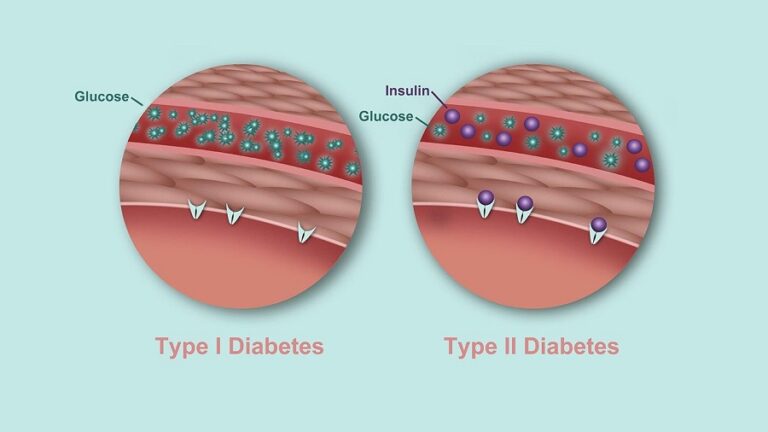
The glycemic load is used to develop an eating plan for people with diabetes, prediabetes, or insulin resistance.
To better understand how this parameter works, the glycemic load formula is described below as well as a complete food table.
Glycemic load of foods (GL) – What is it?
The glycemic load ( GL ) is the indicator that quantitatively measures the increase in blood glucose that occurs after eating a meal.
Unlike the glycemic index (GI), the glycemic load takes into account not only the quality of carbohydrates in food; but also its quantity .
For example, carrot juice has a high GI glycemic index, but only contains a few grams of carbohydrates per serving. The result: a low glycemic load.
The glycemic load takes into account the amount of total carbohydrates in food and also the rate at which they are absorbed.
According to the latest research, it is not only products with a high glycemic index, but those with a high glycemic load that should be moderate for diabetics or people with insulin resistance . (1,2,3)
Read on to see a table with the differences between CG and IG.
Glycemic load – formula
The glycemic load tables of the foods presented at the end of this article were obtained through a mathematical calculation based on the following formula:
CG = GI * (number of grams of carbohydrates per serving) / serving size
The formulas are not only used to calculate the glycemic load of individual foods, but also the total GL needed per day.
The ideal in a healthy person is not to exceed a CG value of 100 units. In a type 2 diabetic diet, applying the glycemic load formula should not exceed 60-80 units per day.
Glycemic load chart How to use it?
According to the individual values of the glycemic load of foods, these can be divided into three categories:
- Low : less than 10
- Media: 11-19
- High : more than 20
The following ranges are used to calculate the total glycemic load of a person’s diet :
- Healthy eating: no more than 100
- Weight loss diet: no more than 80
- Diabetic diet: 60 -70
A table of glycemic load of foods is described below:
| Food | IG | Portion | Glycemic load |
| Breads and derivatives | |||
| Banana bread | 47 | 60 g | 14 |
| Vanilla cake | 42 | 60 g | 12 |
| White bread | 72 | 70 g | 25 |
| Pretzels | 58 | 30 g | 12 |
| Pita bread | 68 | 30 g | 10 |
| Corn tortilla | 52 | 50 g | 12 |
| Pan integral | 34 | 30 g | 7 |
| Drinks and refreshments | |||
| Coca Cola | 63 | 250 mL | 16 |
| Boys | 68 | 250 mL | 12 |
| Apple juice | 44 | 250 mL | 30 |
| Gatorade | 78 | 250 mL | 24 |
| Orange juice | 50 | 250 mL | 12 |
| Tomato juice | 38 | 250 mL | 12 |
| Cereals and derivatives | |||
| Sugary cereals | 93 | 30 g | 23 |
| Muesli | 66 | 30 g | 16 |
| Avena | 40 | 250 g | 13 |
| Quinoa | 53 | 150 g | 13 |
| White rice | 83 | 150 g | 43 |
| Integral rice | 50 | 150 g | 16 |
| Bulgur wheat | 48 | 150 g | 12 |
| Milk and derivatives | |||
| Common ice cream | 57 | 50 | 6 |
| Whole milk | 41 | 250 mL | 5 |
| Skimmed milk | 32 | 250 mL | 4 |
| Skimmed yogurt with fruits | 33 | 200 mL | 11 |
| Fruits | |||
| Apple | 39 | 120 | 6 |
| Banana banana | 62 | 120 | 16 |
| Grapes | 59 | 120 | 11 |
| Pomelo | 25 | 120 | 3 |
| Oranges | 40 | 120 | 4 |
| Peach – peach | 42 | 120 | 5 |
| Pears | 38 | 120 | 4 |
| Watermelon | 72 | 120 | 4 |
| Legumes and nuts | |||
| White beans | 40 | 150 | 7 |
| Black beans | 30 | 150 | 7 |
| Lentils | 29 | 150 | 5 |
| Peanuts | 7 | 50 | 0 |
| Walnuts | 7 | 50 | 0 |
| Chestnuts with salt | 27 | 50 | 3 |
| Soy beans | 15 | 150 | 1 |
| Pasta and flours | |||
| Fetuccini | 32 | 180 | 15 |
| Macaroni | 47 | 180 | 23 |
| Raviolis | 47 | 180 | 32 |
| Fresh spaghetti | 58 | 180 | 26 |
| Spaghetti integral | 28 | 180 | 14 |
| Margarita pizza | 60 | 100 | 19 |
| four cheese pizza | 80 | 100 | 22 |
| Vegetables | |||
| Carrots | 45 | 150 | 12 |
| White potatoes | 82 | 150 | 21 |
| Sweet potatoes | 70 | 150 | 22 |
| Broccoli | 10 | 150 | 4 |
| Lettuce | 10 | 150 | 3 |
| Onion | 60 | 150 | 16 |
Complete table of glycemic load of foods (3) (4)
How to lower the glycemic load?
A high glycemic load value of a food will mean a significant and rapid increase in blood glucose levels. This, in turn, will lead to the production of large amounts of insulin.
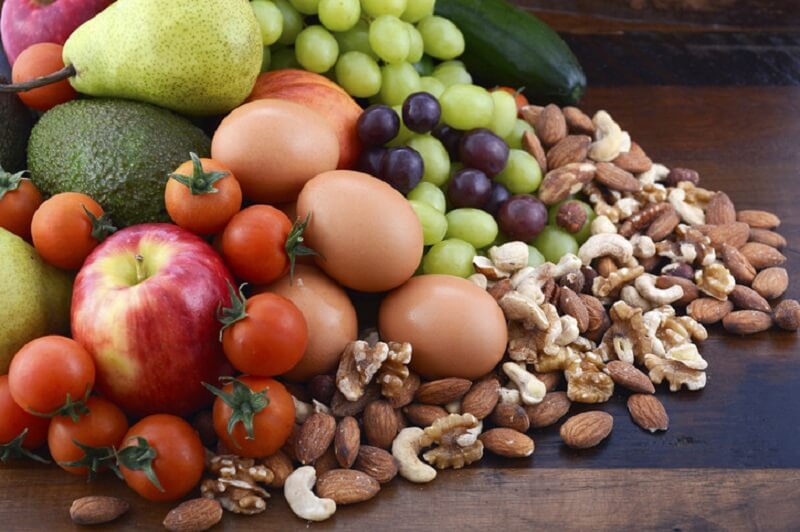
To lower the glycemic load, you should combine carbohydrate foods with foods with fiber and healthy fats . These two food groups are the lowest in value on the food charts.
Combining them with foods high in fiber or fat is effective in lowering the glycemic load values at each meal.
Differences with the glycemic index and insulin index
The glycemic index of a particular food measures the rate of a rise in blood glucose after eating a serving.
The glycemic load uses the base of the glycemic index and adds the quantity parameter.
The insulin index considers the increase in insulin (not glucose) in the blood and is the most accurate indicator for diabetics. This value takes into account the effects of particular food combinations for example: dairy and meat.
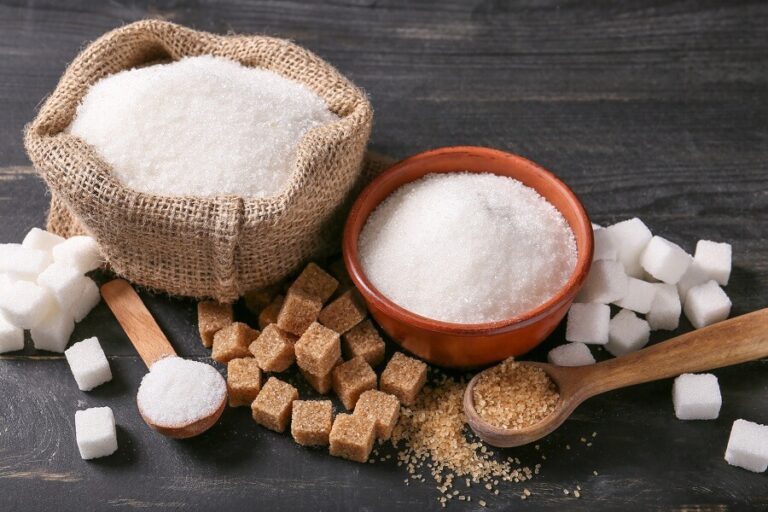
It is important to know that to achieve optimal long-term health, all theories agree that you should avoid foods that are sugary or contain high content of other simple carbohydrates .
Avoiding excess sugar in the diet is essential to obtain good values for both glycemic load, glycemic index and insulin index.
ABSTRACT
Glycemic load is an indicator that takes into account not only the rate at which blood sugar levels rise, but also the total amount of carbohydrates in each meal.
Its formula can be used to calculate the glycemic load, although there are also food tables.
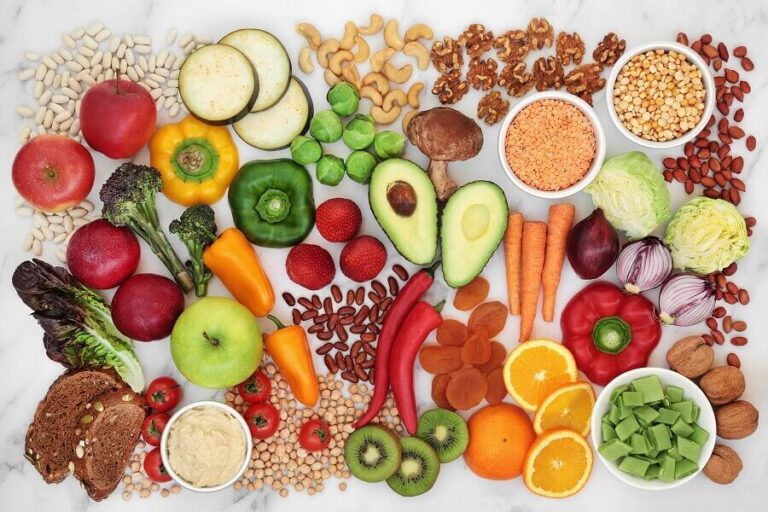
The foods with the lowest glycemic load value in the table are foods rich in fiber and fat, for example vegetables and nuts.
This indicator is useful for developing an eating plan for people with diabetes or other metabolic disorders.